

AUTHOR: Stephanie Schuster, PhD, Senior Technical Support Scientist, Advanced Materials Technology 20 Years of High…

Increasing Sensitivity while Reducing Solvent Consumption with HALO® 1.5 mm UHPLC Columns
Using 1.5 mm ID Columns for Solvent Reduction While Increasing Sensitivity
Originally, HPLC methods were developed using 4.6 mm ID columns and greater. At the time, the separations were acceptable, and not much emphasis was placed on either reducing solvent consumption or increasing sensitivity. Eventually, 3.0 mm ID columns were introduced as a means of reducing solvent consumption and offered increased sensitivity when the same sample mass was used. Furthermore, 2.1 mm ID columns arrived for use with UHPLC and for interfacing to mass spectrometers. As UHPLC column technology and instrumentation have progressed, the move to smaller ID columns has proven to be advantageous. Now novel HALO® 1.5 mm ID columns are available from Advanced Materials Technology for those who would like the advantages of reduced column ID without the legwork needed when moving to capillary systems.
What does 1.5 mm ID deliver?
The new HALO® 1.5 mm ID columns deliver increased sensitivity, improved ionization efficiencies, reduced solvent consumption, and ease of use (1). When moving a method from a 2.1 mm ID column to a HALO 90 Å C18, 2.7 µm, 1.5 x 100 mm column, the flow rate must be scaled to maintain the same linear velocity. Equation 1 shows how to scale flow rate.

F2 is the scaled flow rate for the 1.5 mm ID column, F1 is the original flow rate, R2 is the radius (0.75 mm), R1 is the radius of the original column, D2 is 1.5 mm, and D1 is the diameter of the original column.
The slower flow rate coupled with the same injection volume/concentration injected on the column generates areas that are as large as twice those of the 2.1 mm ID column along with a signal increase as shown in Figure 1 for a separation of over-the-counter (OTC) cough and cold medicines.

Figure 1. Comparison of 1.5 mm ID to 2.1 mm ID showing increased signal intensity and double the peak area for the results with the 1.5 mm ID column for separation of OTC cough and cold medicines.
PEAK IDENTITIES
- Phenylephrine
- Acetaminophen
- Caffeine
- Doxylamine
- Guaifenesin
- Aspirin
- Salicylic Acid
- Dextromethorphan
Increased sensitivity can be especially advantageous when running impurity analyses. For example, salicylic acid (peak 4) is an impurity in acetylsalicylic acid (aspirin; peak 3). When the same concentration is injected on a HALO 90 Å C18, 2.7 µm, 1.5 x 100 mm column, an increase in the signal area is observed.
See Figure 2 for the comparison of the response between the 1.5 and 3.0 mm ID columns.

Figure 2. Comparison of 1.5 mm ID to 3.0 mm ID showing increased signal intensity for an example of an impurity analysis using salicylic acid.
PEAK IDENTITIES
- Acetaminophen
- Caffeine
- Aspirin
- Salicylic Acid
Improved ionization efficiencies using LCMS can be achieved when 1.5 mm ID columns are used. Figure 3 is an example comparing intact trastuzumab run on a 1.5 mm ID column compared to a 2.1 mm ID column. The area of the trastuzumab peak is 2.9 times larger and the peak height is increased when the 1.5 mm ID column is used compared to the 2.1 mm ID column.

Figure 3. Increased area and taller peaks are observed on the HALO 1000 Å Diphenyl, 2.7 µm, 1.5 x 150 mm column for intact trastuzumab compared to the same stationary phase in 2.1 x 150 mm.
Similarly, when reduced and alkylated trastuzumab is run on a HALO 1000 Å Diphenyl, 2.7 µm, 1.5 x 150 mm column compared to a 2.1 x 150 mm column, the peak area of the heavy chain is 2.3 times larger and the peak area of the light chain is 2.7 times larger all while running at half the flow rate. See the comparison in Figure 4.

The next example (Figure 5) shows both increased area and intensity for norfentanyl and fentanyl run on a HALO 90 Å Biphenyl, 2.7 µm, 1.5 x 100 mm column. In order to achieve this result, the source conditions for the mass spectrometer were optimized to better suit the reduced flow rate used for the 1.5 mm ID column.

Figure 5. Improved intensity and area for norfentanyl and fentanyl run on a HALO 90 Å Biphenyl, 2.7 µm, 1.5 x 100 mm column compared to the same phase in 2.1 x 100 mm.
Another advantage to running HALO® 1.5 mm ID columns is reduced solvent consumption. When scaling from larger ID columns to 1.5 mm ID columns, lower flow rates are used. This means that not only is less solvent consumed, but also the waste disposal costs are reduced. The typical cost to dispose of 1 L of solvent waste is $20-30/L. Transferring a peptide map from a 2.1 mm ID to a 1.5 mm ID column results in 50% solvent savings – the amount of required solvent is reduced and less waste is generated. Figure 6 shows the comparison of the separation and a plot of the solvent used/injection. In addition to the solvent savings, the 1.5 mm ID column shows increased signal intensity, which is an advantage for low-abundance peptide fragments.

Figure 6. 50% solvent savings for a trastuzumab peptide map run using a HALO 160 Å ES-C18, 2.7 µm, 1.5 x 150 mm column compared to the same phase in 2.1 x 150 mm.
Another example of reduced solvent consumption is illustrated with the comparison of the separation of cannabinoids transferred from a 4.6 mm ID column to a 1.5 mm ID column. See Figure 7 for the separation and a plot of the solvent savings. In this case, 9.4 times less solvent is used with the 1.5 mm ID column compared to the 4.6 mm ID column. Injecting the same concentration of sample on both columns results in increased signal intensity/peak areas, as well.

Figure 7. 9.4 times less solvent is used for a separation of 13 cannabinoids using a HALO 90 Å C18, 2.7 µm, 1.5 x 150 mm column compared to the same phase in 4.6 x 150 mm.
PEAK IDENTITIES
- CBDVA
- CBDV
- CBDA
- CBGA
- CBG
- CBD
- THCV
- THCVA
- CBN
- 9-THC
- 8-THC
- CBC
- THCA
The HALO® 1.5 mm ID columns are similar to the look and feel of HALO® 2.1 mm ID columns and offer ease of use. The stability of a HALO 1000 Å Diphenyl, 2.7 µm, 1.5 x 150 mm column was tested using 600 bar for 1000 injections. No loss in efficiency or retention was observed over the course of the experiment. See Figure 8 for the comparison of the initial injection to injection 1000.

Another example (Figure 9) of stability was run using a HALO 90 Å C18, 2.7 µm, 1.5 x 150 mm column. Similar to the HALO 1000 Å Diphenyl 1.5 x 150 mm column, the retention of the column was stable over the course of 1000 injections run at 600 bar. The %RSD for the retention factor of naphthalene was 0.28%.

Figure 9. Demonstration of stability at 600 bar for 1000 injections for a HALO 90 Å C18, 2.7 µm, 1.5 x 150 mm column.
Three different lots of 1.5 mm column hardware were loaded with the same lot of HALO 90 Å C18 to illustrate the reproducibility of the hardware. A separation of OTC cough and cold medicines showed retention time %RSDs of 1% or lower among the three columns. See Figure 10 for the comparison.

Figure 10. Excellent reproducibility for the results from the same HALO 90 Å C18 lot loaded in three different lots of 1.5 mm ID hardware. Test conditions same as in Figure 1.
PEAK IDENTITIES
- Phenylephrine
- Acetaminophen
- Caffeine
- Doxylamine
- Guiafenesin
- Aspirin
- Salicylic Acid
- Dextromethorphan
The benefit of having Fused-Core® particles in 1.5 mm ID hardware enables faster flow rates to be used with no significant reduction in resolution. Figure 11 shows the comparison of a 6 min gradient method run at 0.2 mL/min to a 3 min gradient method run at 0.4 mL/min. Both of these gradients were run on a HALO 90 Å C18, 2.7 µm, 1.5 x 100 mm column. The baseline resolution of the critical peak pair of 3 and 4 was slightly reduced from 5.4 to 4.3.
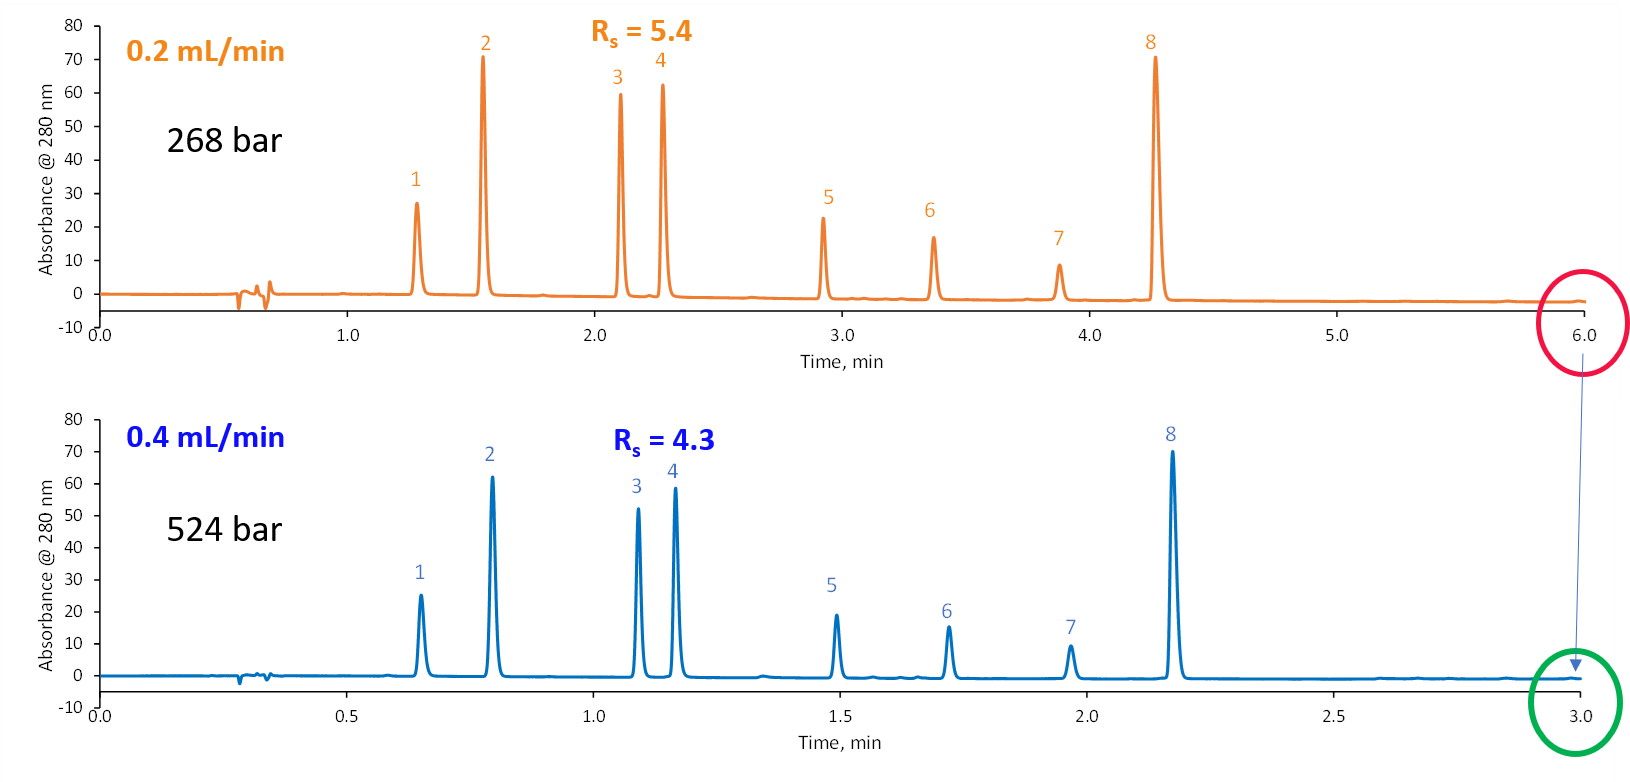
Figure 11. 2 times faster with minimal loss in resolution!
How should 1.5 mm be implemented?
In order to obtain the benefits of HALO® 1.5 mm ID columns, UHPLC systems with low extra column dispersion (ECD) are needed. ECD occurs naturally as sample bands travel from the injector to the detector. ECD includes the injection volume, the pre-column tubing, the post-column tubing, and the detector flow cell. See Figure 12. The smaller the column ID, the more impact ECD has on the observed efficiency of the column. For a more detailed explanation of ECD, the reader is referred to the 4 part series on the topic in LCGC North America by Stoll, Lauer, and Broeckhoven (2-5).

Figure 12. Sources of extracolumn dispersion with orange being pre-column and blue being post-column.
A convenient way to estimate ECD is to use the Web-based dispersion calculator (6) that was introduced in part 4 of the ECD series of articles in LCGC North America. See the pie charts on the right-hand side of Figure 13. For gradient separations, only the post-column components (tubing and detector flow cell) contribute to the total dispersion of the system. For easy interpretation, the goal is to maximize the area of the yellow pie slice, which corresponds to the dispersion from the column. The maximum amount of efficiency will be observed from the column when the ECD is minimized.
For the standard set-up shown in Figure 13, the ECD was 12 µL2, while the optimized set-up shown had 2 µL2 of ECD. The impact of the larger amount of ECD is observed as broader peaks with reduced signal intensity. Specifically, peak 8 went from 66 mAU/0.046 min peak width to 105 mAU/0.037 min peak width when the ECD was reduced.

Figure 13. Impact of dispersion on HALO® 1.5 mm ID columns.
One way to reduce ECD is to use a smaller ID and shorter lengths connecting tubing before and after the column. Several manufacturers offer such tubing in pre-cut lengths with the fittings built in for convenience. AMT has partnered with IDEX to offer MarvelXACT™ connectors in PEEKsil™ and PEEK-Lined Stainless Steel options. PEEKsil™ is recommended for plumbing HALO® 1.5 mm ID columns directly to the mass spectrometer source while PEEK-Lined Stainless Steel is recommended for connections between the sample injector and the column. The volume is indicated with the connector dimension for easy selection.
Conclusions
HALO® 1.5 mm ID columns offer analysts who want the advantages of using smaller ID columns without all of the extra legwork that comes with switching to capillary HPLC systems the increased signal intensity and reduced solvent use and lower waste disposal costs of reduced ID columns. It is important to remember that smaller ID columns are more subject to ECD so the UHPLC must be optimized in terms of its connecting tubing and/or detector flow cell. These reductions in tubing ID must be balanced with the operating pressure limits of the UHPLC.
Author: Dr. Stephanie Schuster, Senior Technical Support Scientist from Advanced Materials Technology
For more information, please contact: support@advanced-materials-tech.com
References
1. B.P. Libert, J.M. Godinho, S.W. Foster, J.P. Grinias, B.E. Boyes, Implementing 1.5 millimeter Internal DiameterColumns into Analytical Workflows, Journal of Chromatography A. 1676 (2022) 463207, doi: 10.1016/j.chroma.2022.463207
2. D.R. Stoll, K. Broeckhoven, Where Has My Efficiency Gone? Impacts of Extracolumn Peak Broadening on Performance, Part I: Basic Concepts, LCGC North America. 39 (2021) 159–166.
3. D.R. Stoll, K. Broeckhoven, Where Has My Efficiency Gone? Impacts of Extracolumn Peak Broadening on Performance, Part II: Sample Injection, LCGC North America. 39 (2021) 208–213.
4. D.R. Stoll, K. Broeckhoven, Where Has My Efficiency Gone? Impacts of Extracolumn Peak Broadening on Performance, Part III: Tubing and Detectors, LCGC North America. 39 (2021) 252–257.
5. D.R. Stoll, T.J. Lauer, K. Broeckhoven, Where Has My Efficiency Gone? Impacts of Extracolumn Peak Broadening on Performance, Part IV: Gradient Elution, Flow Splitting, and a Holistic View, LCGC North America. 39 (2021) 308–314.
Related Posts


